Land
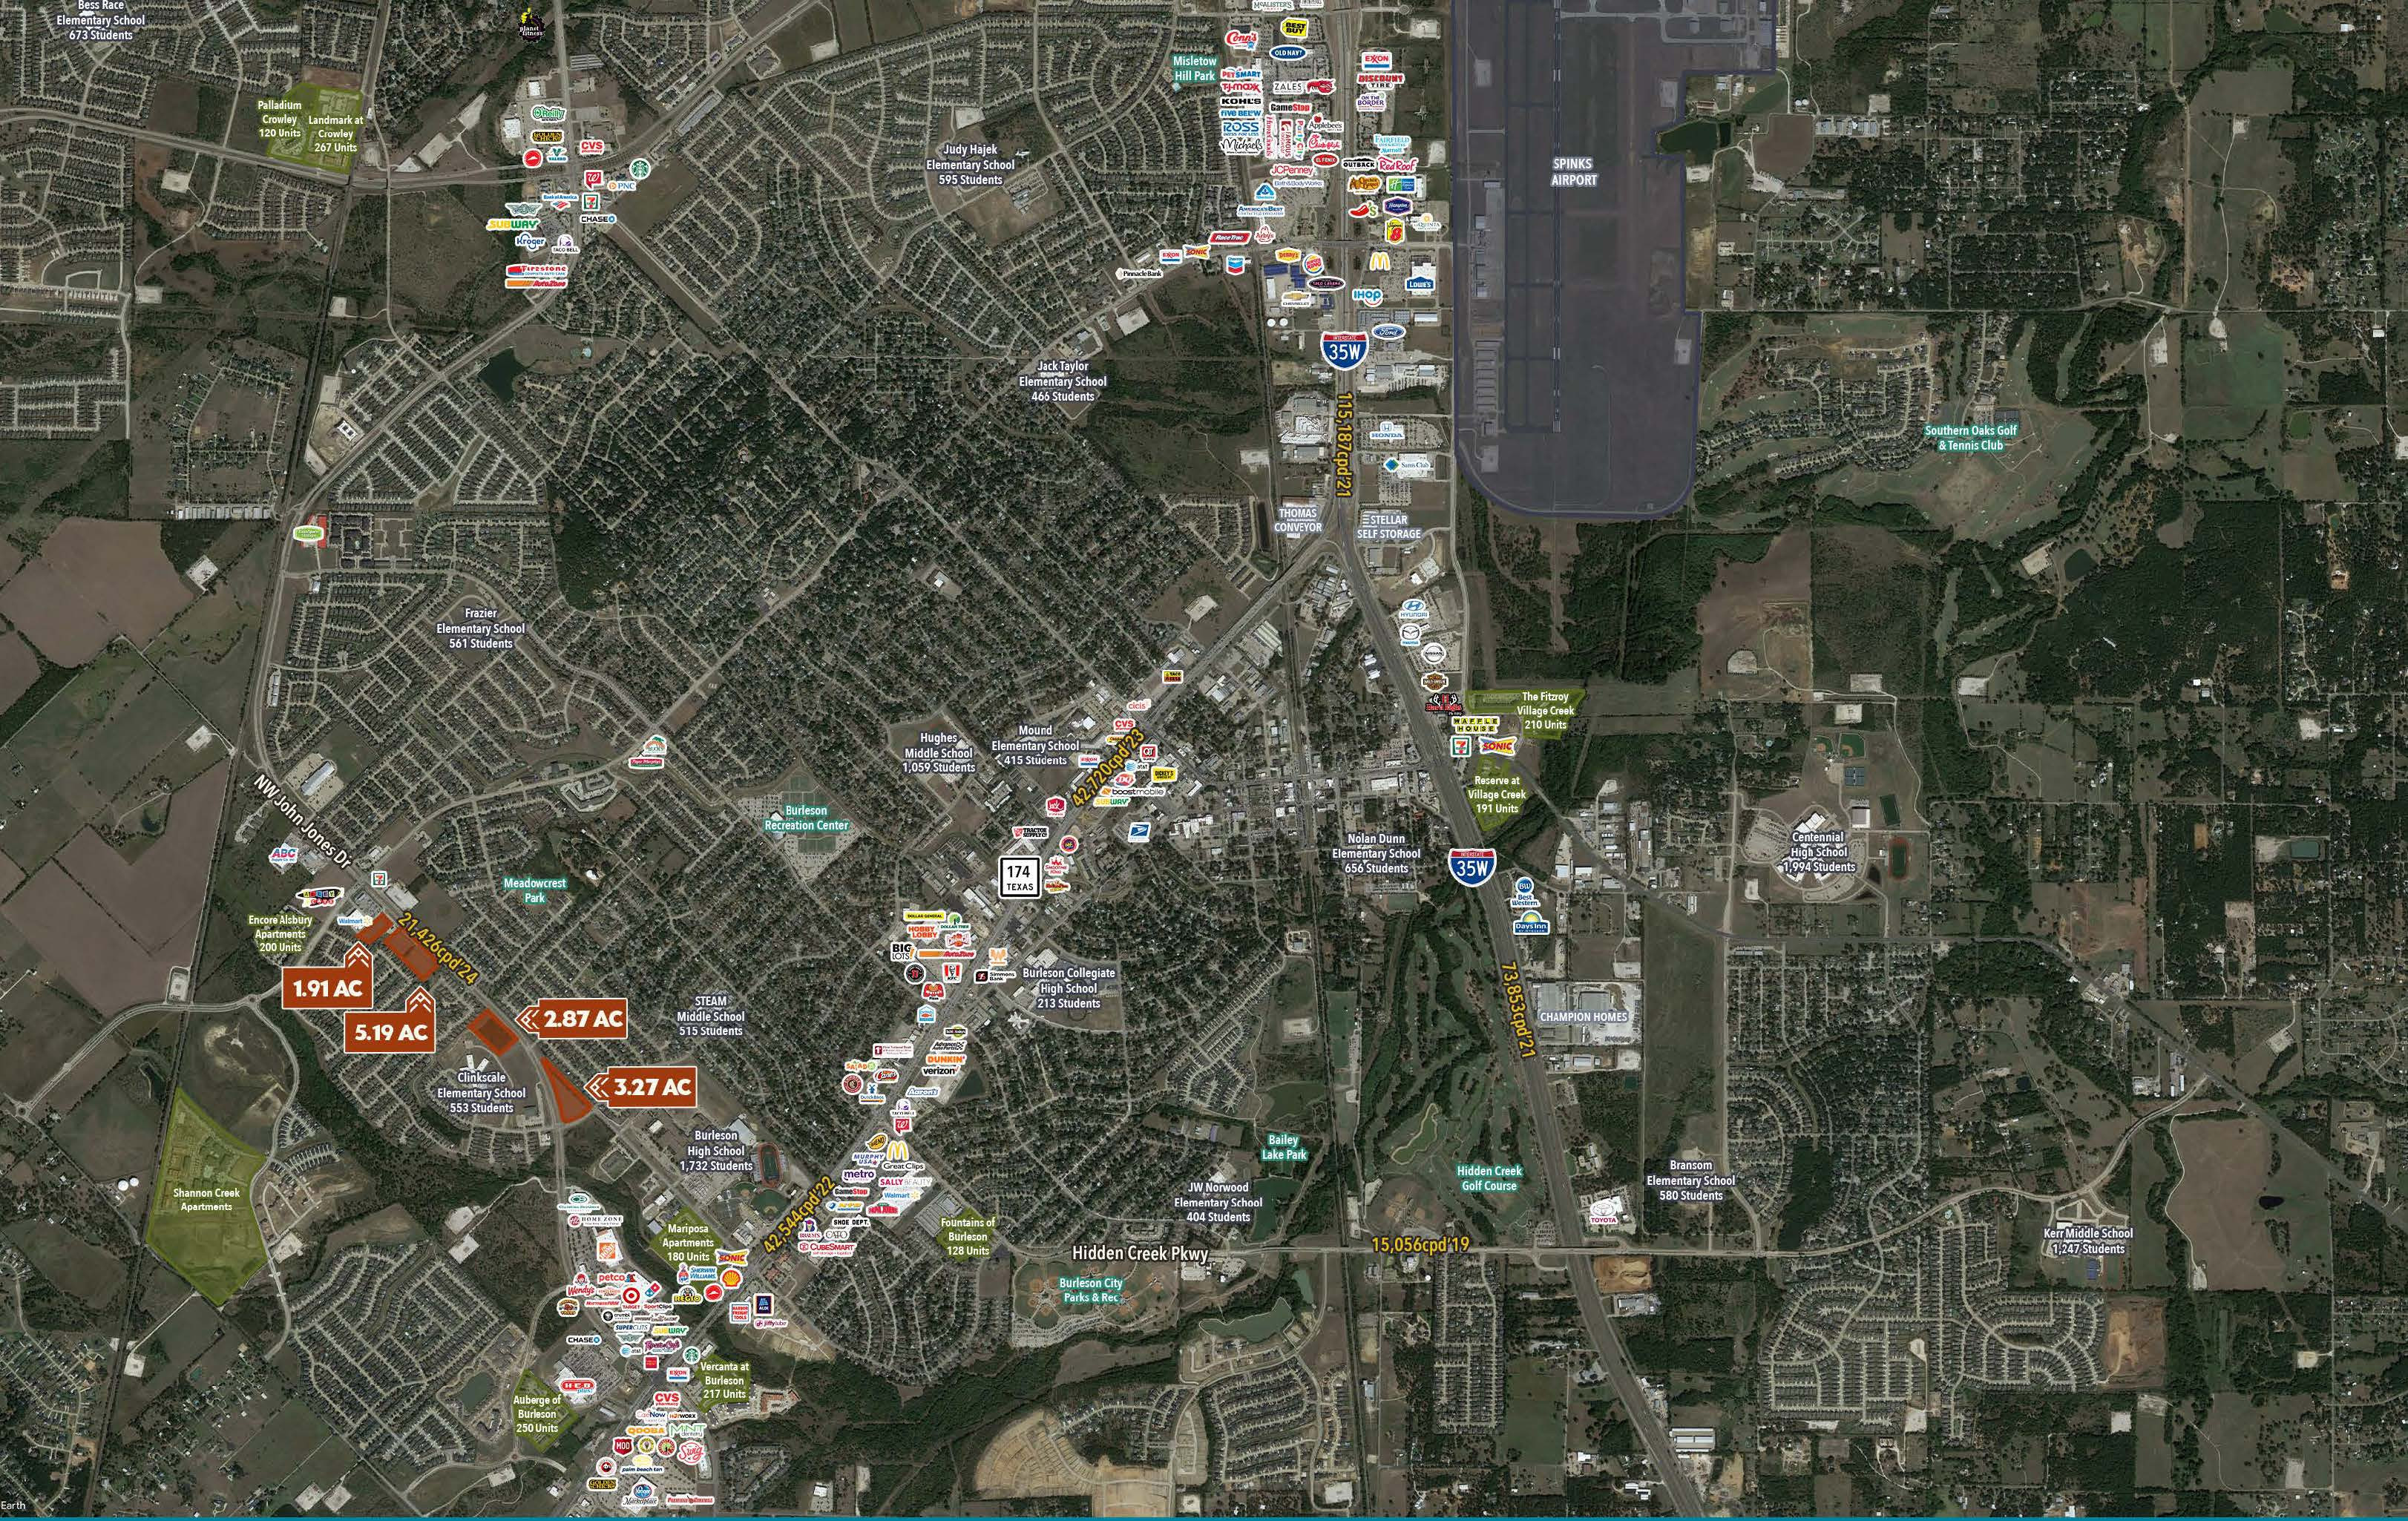
Burleson Land Tracts
Along John Jones Dr, between Alsbury Blvd & Hillside Dr Burleson TX, 76028
Up to 13.24 AC (4 tracts)
- Hard corner location with excellent visibility
- Zoned Light Industrial - a variety of uses allowed
- Utilities available
{"center":{"lat":"32.536026558518","lng":"-97.358541285391"},"controls":["navigationControl","fullscreenControl"],"id":"cartographer_field_68f8b9cf8ced3","styles":"mapbox:\/\/styles\/mapbox\/satellite-streets-v9","markers":[{"id":"28f8c831-4e02-414b-a36c-64f264aa2a1e","position":{"lat":"32.537140456778","lng":"-97.359752908917"},"color":null},{"id":"1bfa930f-7943-42af-bdd1-b46e543e4eae","position":{"lat":"32.533403785848","lng":"-97.355426170461"},"color":null},{"id":"2c9a9aa5-23b6-4acc-b194-5cf4c6ae1dc2","position":{"lat":"32.531001558248","lng":"-97.352128351484"},"color":null},{"id":"8ef58559-bfbd-4df1-8ee6-a00dcebc1089","position":{"lat":"32.535985495522","lng":"-97.358519974327"},"color":null}],"zoom":14}
Demographics
1 Mi. |
3 Mi. |
5 Mi. |
|
|---|---|---|---|
Population |
11,652 |
52,959 |
93,987 |
Projected Annual Growth 2022-27 |
1.4% |
2.0% |
1.8% |
Median Age |
31.7 |
33.7 |
34.7 |
Number of Households |
3,926 |
18,704 |
32,124 |
Avg. Household Income |
$81,749 |
$82,282 |
$86,295 |
Med. Household Income |
$85,616 |
$81,387 |
$81,488 |
Traffic
Statistics from TXDOT 2025Vehicles/Day |
|
|---|---|
NW John Jones Dr |
21,178 |
Hwy 174 |
45,637 |
Nearby Traffic Generators
- Home Depot
- Target
- Walmart
- HEB
- Aldi
- Harbor Freights
- Walgreens
- CVS
- Exxon
- QuickTrip
- Shell
- 7 Eleven
- Murphy USA
- Sonic
- Torchy's Tacos
- Starbucks
- Braum's
- Hobby Lobby
- Subway
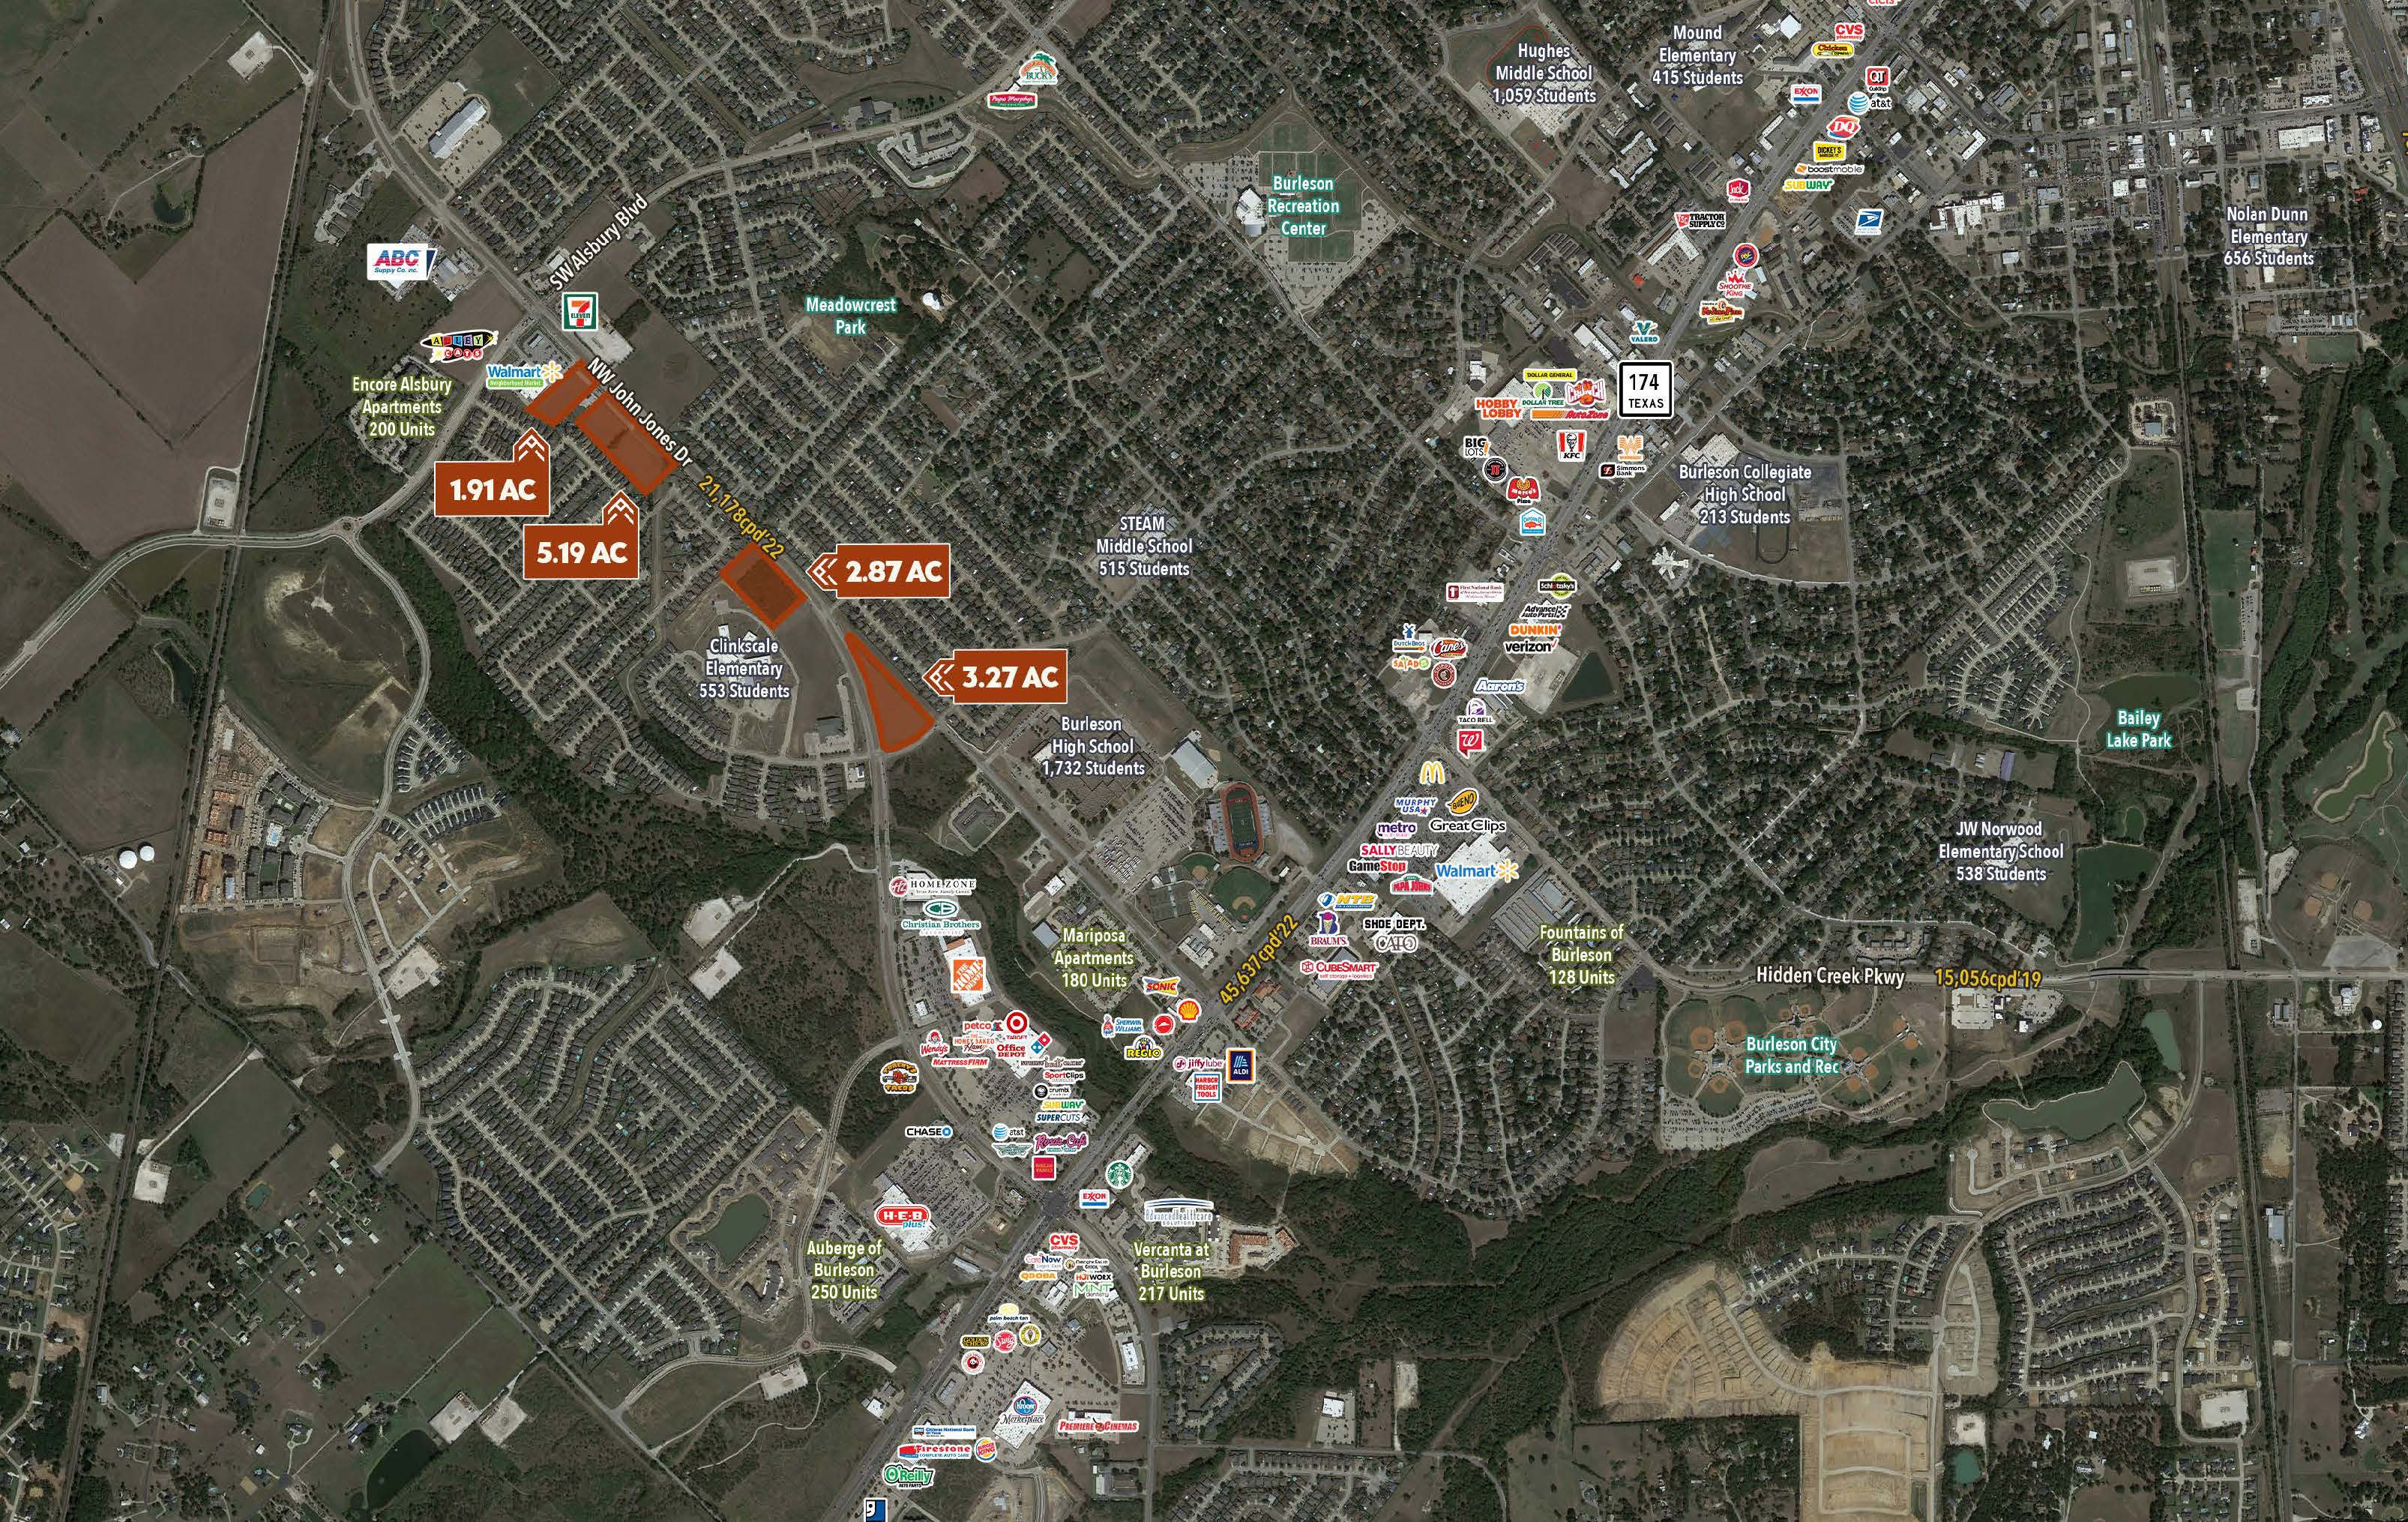
Land Tracts
Acreage |
|
|---|---|
Tract 1 |
1.91 |
Tract 2 |
5.19 |
Tract 3 |
2.87 |
Tract 4 |
3.27 |